echarts 初始化篇
- 去GitHub上找到 echarts-for-weixin 并将其clone到本地
- 将其中的ec-canvas目录复制到自己项目的某个目录下
- 根据需要,替换echarts.js
React+Taro+TS+微信小程序篇
- 使用分包将对应图形的ec-canvas放在分包组件中
- 新建一个.tsx后缀的页面,引入ec-canvas中的echarts
- 定义data类型
- 初始化data数据、option和charts.init
- 在页面返回
1
<ec-canvas id="自定义" canvas-id="自定义" ec={{onInit: 初始化函数}} />
- 在
<ec-canvas />外在包裹一层并且给个高度 - 初始化图表
- 设置data数据
- 设置option数据
- 示例(饼图)
1
2
3
4
5
6
7
8
9
10
11
12
13
14
15
16
17
18
19
20
21
22
23
24
25
26
27
28
29
30
31
32
33
34
35
36
37
38
39
40
41
42
43
44
45
46
47
48
49
50
51
52
53
54
55
56
57
58
59
60
61
62
63
64
65
66
67
68
69
70
71
72
73
74
75
76
77
78
79
80
81
82
83
84
85
86
87
88
89
90
91
92
93
94
95
96
97
98
99
100
101
102
103
104
105
106
107
108
109
110
111
112
113
114
115
116
117
118
119
120
121
122
123
124
125
126
127
128
129
130
131
132
133
134
135
136
137
138
139
140
141
142
143
144
145
146
147
148
149
150
151
152
153
154
155
156
157
import * as echarts from '../../components/ec-canvas/echarts'
import { memo, useEffect, useRef } from 'react'
import { View } from '@tarojs/components'
import { NoteLabelDto } from '@apis/itinerary'
import { useImmer } from 'use-immer'
interface PieProps {
list: NoteLabelDto[]
}
interface pieDataType {
value: number
name: string
}
const Pie = memo<PieProps>((props) => {
const { list } = props
const [pieData, setPieData] = useImmer<pieDataType[]>([])
const chartRef = useRef<any>()
const optionRef = useRef({
backgroundColor: '#ffffff',
series: [
{
label: {
formatter: (params) => {
return `{hr|} {name|${params.name}}\n{value|${params.value}%}`
},
minMargin: 5,
lineHeight: 15,
fontSize: 14,
rich: {
name: {
fontWeight: 600,
lineHeight: 18,
},
value: {
fontWeight: 'normal',
color: 'rgba(0, 0, 0, 0.65)',
lineHeight: 18,
},
hr: {
backgroundColor: 'auto',
borderRadius: 5,
width: 5,
height: 5,
padding: [5, 5, 0, 0],
},
},
},
type: 'pie',
stillShowZeroSum: false,
center: ['50%', '50%'],
radius: ['20%', '40%'],
emphasis: {
disabled: true,
scale: false,
},
itemStyle: {
borderWidth: 0,
},
data: pieData,
},
],
})
// 设置option数据
useEffect(() => {
optionRef.current = {
backgroundColor: '#ffffff',
series: [
{
label: {
formatter: (params) => {
return `{hr|} {name|${params.name}}\n{value|${params.value}%}`
},
minMargin: 5,
lineHeight: 15,
fontSize: 14,
rich: {
name: {
fontWeight: 600,
lineHeight: 18,
},
value: {
fontWeight: 'normal',
color: 'rgba(0, 0, 0, 0.65)',
lineHeight: 18,
},
hr: {
backgroundColor: 'auto',
borderRadius: 5,
width: 5,
height: 5,
padding: [5, 5, 0, 0],
},
},
},
type: 'pie',
stillShowZeroSum: false,
center: ['50%', '50%'],
radius: ['20%', '40%'],
emphasis: {
disabled: true,
scale: false,
},
itemStyle: {
borderWidth: 0,
},
data: pieData,
},
],
}
if (!chartRef.current) return
chartRef.current.setOption(optionRef.current)
}, [pieData])
//设置data数据
useEffect(() => {
const _data = list.map((item) => {
const value = item.percent.slice(0, -1)
return {
value: parseInt(value),
name: item.name,
itemStyle: { color: item.val },
}
})
setPieData(_data)
}, [list, setPieData])
// 初始化图表
const initChart = (canvas, width, height, dpr) => {
const chart = echarts.init(canvas, null, {
width: width,
height: height,
devicePixelRatio: dpr,
})
chartRef.current = chart
canvas.setChart(chart)
chart.setOption(optionRef.current)
return chart
}
return (
<View style={{ height: '600rpx' }}>
<ec-canvas
id="mychart-dom-pie"
canvas-id="mychart-pie"
ec={{ onInit: initChart }}
/>
</View>
)
})
export default Pie
React+TS篇
安装echarts
1
npm install echarts
把获取dom和高度及初始化ECharts的方法先封装好写成组件
示例(适用多个类型的echart)
1
2
3
4
5
6
7
8
9
10
11
12
13
14
15
16
17
18
19
20
21
22
23
24
25
26
27
import * as echarts from 'echarts'
import React, {useEffect, useRef} from "react";
type Chart = {
option:any
}
const MoneyChart:React.FC<Chart> = (props) => {
const { option } = props
const chartWrapper = useRef<HTMLDivElement>(null)
const chart = useRef<any>(null)
useEffect(() => {
const height = document.getElementById('root')?.clientHeight
if(!chartWrapper.current) return
chartWrapper.current.style.height =`${height}px`
chart.current=echarts.init(chartWrapper.current,'vintage') //初始化ECharts
},[])
useEffect(() => {
chart.current.setOption(option)
},[option])
return <div ref={chartWrapper} style={{height:'600px'}}/>
}
export default MoneyChart在父组件中调用组件
初始化option和data
分别设置option和data
然后将option传给组件即可
问题与方案
Q1: 关于echart图表显示不出来的问题
- 确认是否使用了webpack5 持久化缓存,启用了持久化缓存后,echarts图表显示不出来(前提是你的图表原本能正常显示)
Q2: 关于标签显示不全问题,标签数据太多,当某个角度的标签太多,标签文字超出边界则显示不出来
- 如标签多已成事实,尽可能标签文本占一行,不要换行
- 设置这些属性
1
2
3minAngle: 15, //最小角度
startAngle: 270, //起始角度
avoidLabelOverlap: true, //是否启用防止标签重叠策略 - 一行文字过多,建议商量去掉部分文字,或开启文字太长省略
1
2
3position: 'outer',
alignTo: 'labelLine',
bleedMargin: 20,
Q3: echart图表警告:没有宽高
- 用style指定宽高
Q4: echart图表在小程序体积过大
- 使用分包
1.把对应的图形的ec-canvas下载下来,
2.将整个ec-canvas放在使用分包的组件内
3.分包组件调用 - 按需定制化echarts,然后替换原文件的echarts.js
Q5: echarts 使用极坐标或坐标图时提示Cannot read properties of undefined (reading ‘findAxisModel’)
- 检查option的参数是否配置正确,是否少了polar 配置或者其他参数
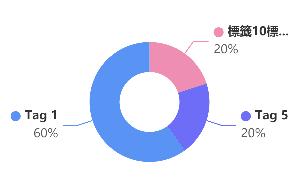
Q6: echarts 给饼图上的文本标签加⚪点样式
- 设置series中的label,在label中的rich中写好样式然后通过的formatter实现
- 效果图
1
2
3
4
5
6
7
8
9
10
11
12
13
14
15
16
17
18
19
20
21
22
23
24
25
26label: {
formatter: (params) => {
returvn `{hr|} {name|${params.name}}\n{value|${params.value}%}`
},
minMargin: 5,
lineHeight: 15,
fontSize: 14,
rich: {
name: {
fontWeight: 600,
lineHeight: 18,
},
value: {
fontWeight: 'normal',
color: 'rgba(0, 0, 0, 0.65)',
lineHeight: 18,
},
hr: {
backgroundColor: 'auto',
borderRadius: 5,
width: 5,
height: 5,
padding: [5, 5, 0, 0],
},
},
},
Q7: echarts 给饼图去掉鼠标滑过的放大效果
- 设置series里的emphasis配置
1
2
3
4emphasis: {
disabled: true, // 关闭高亮
scale: false, // 关闭放大
}
Q8: echarts 使用自定义颜色时标签与颜色不一致
在处理data数据时添加itemStyle:{color: ‘’}
1
2
3
4
5
6
7
8
9
10
11useEffect(() => {
const _data = list.map((item) => {
const value = item.percent.slice(0, -1)
return {
value: parseInt(value),
name: item.name,
itemStyle: { color: item.val },
}
})
setPieData(_data)
}, [list, setPieData])